Customer Churn Analytics Dashboard
Project Information
- Category: Data Analytics
- Domain: Customer Retention and Business Intelligence
- Tools Used: Microsoft Excel, Pivot Tables, Pivot Charts
- Project Type: Dashboard Design and Business Analytics
- Focus Area: Customer Churn Analysis
Project Overview
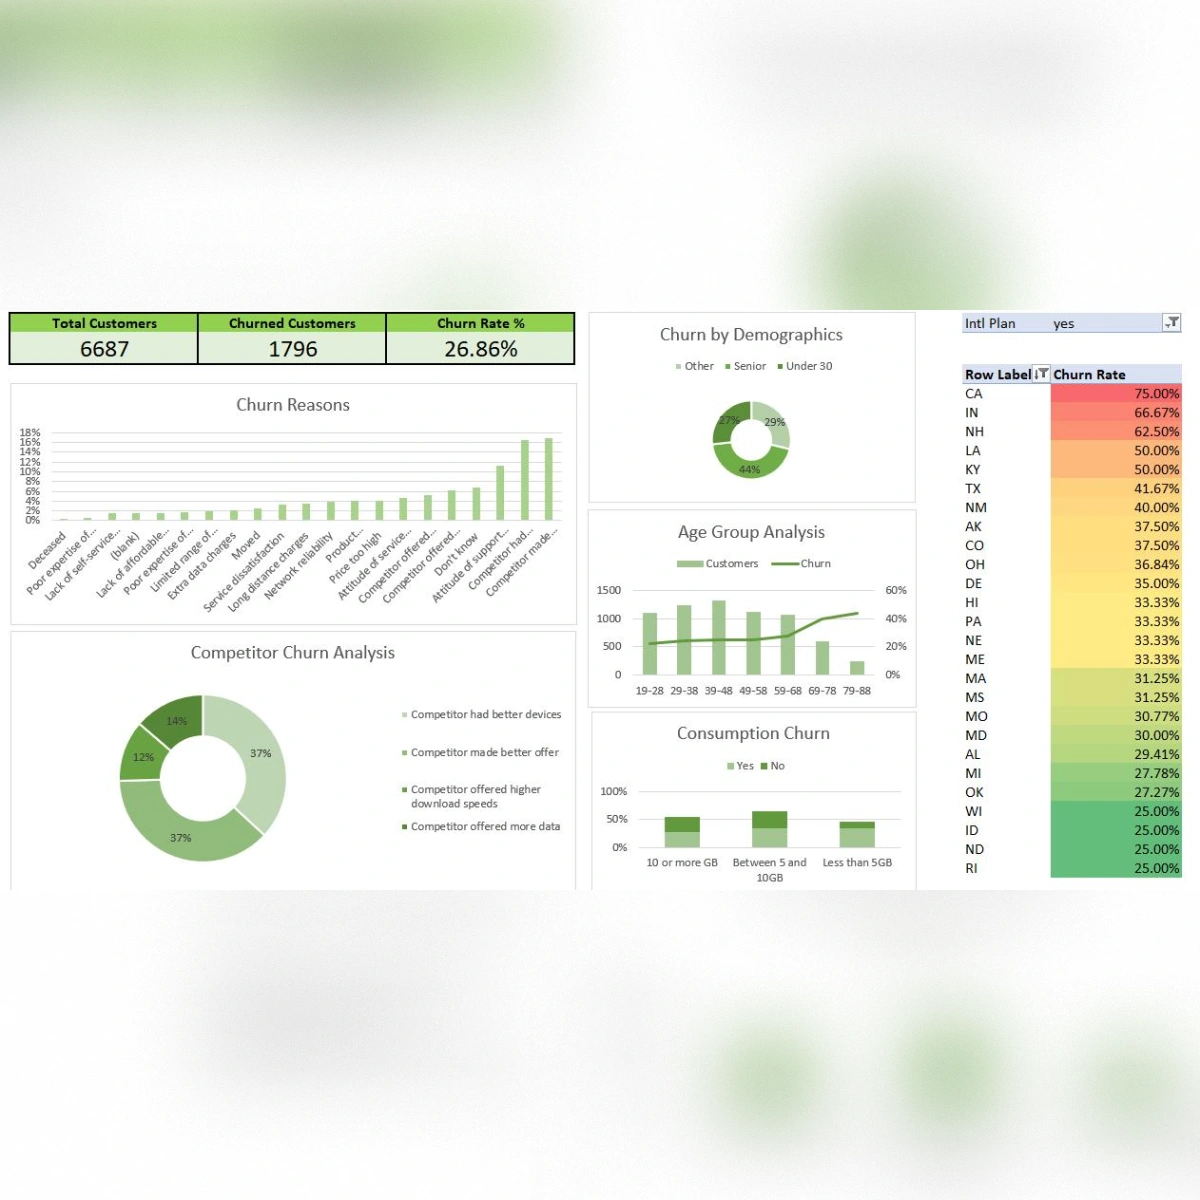
This project focuses on analyzing customer churn patterns through an interactive business intelligence dashboard. The dashboard was designed to identify the major factors behind customer attrition and provide clear insights for improving customer retention strategies.
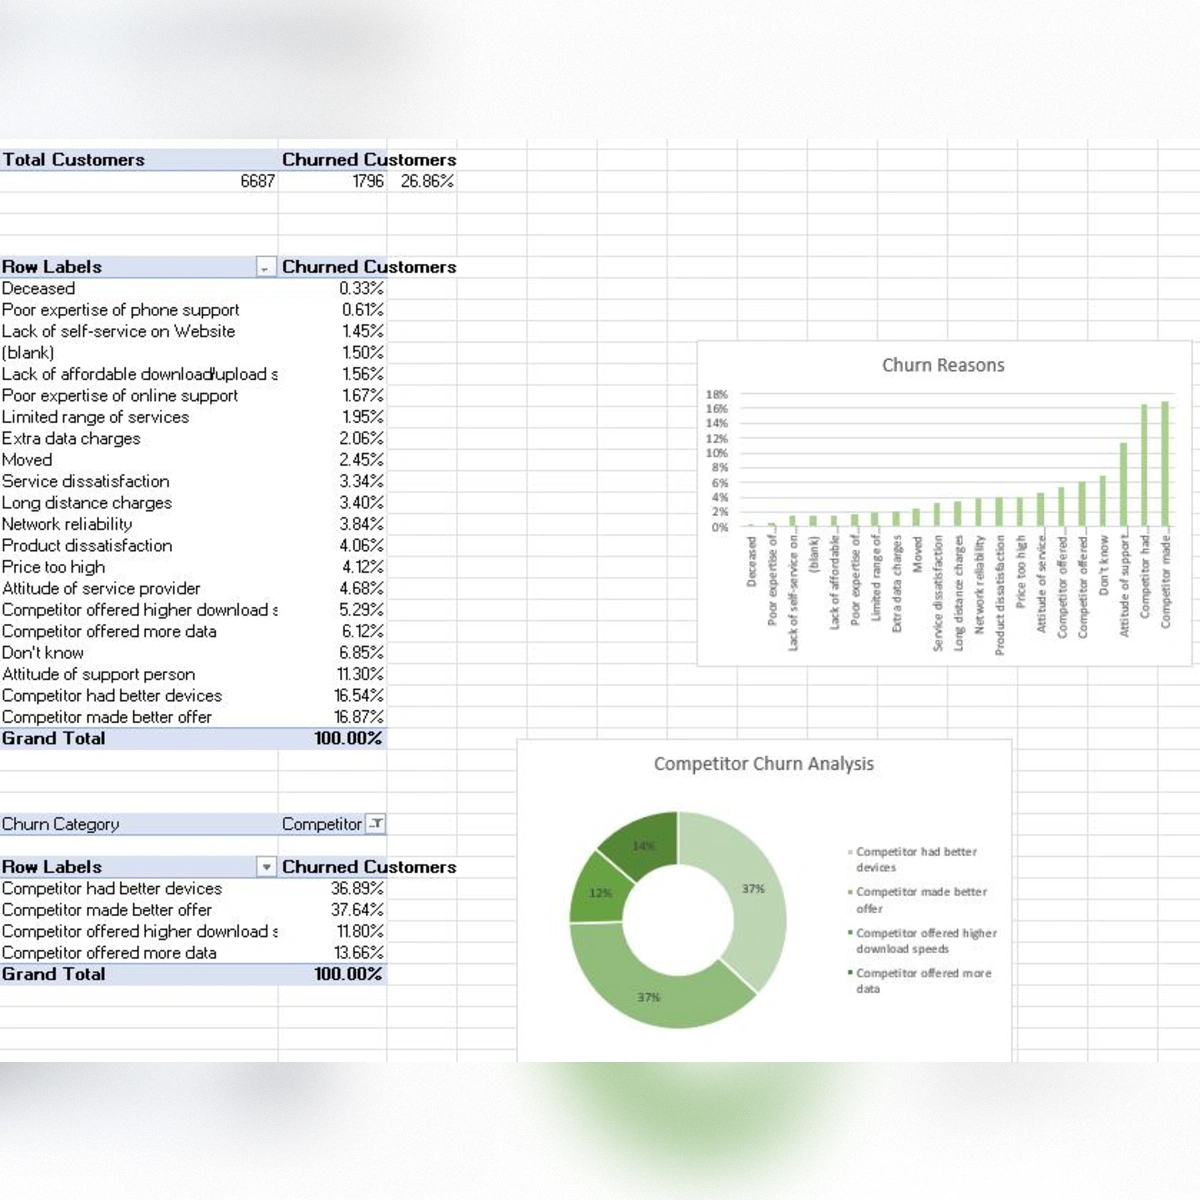
The analysis evaluates churn reasons, customer demographics, age group behavior, consumption patterns, geographical churn variation, and competitor related factors. By converting raw customer information into visual insights, the dashboard helps decision makers identify high risk customer groups and understand the main causes of customer loss.
6,687
Total Customers Analyzed
1,796
Churned Customers
26.86%
Overall Churn Rate
Dashboard Highlights
Churn Reason Analysis
Identified the major reasons behind customer churn, including competitor offers, service dissatisfaction, pricing issues, and support quality concerns.
Demographic Segmentation
Analyzed churn behavior across customer age groups and demographic segments to identify groups with higher churn tendency.
Competitor Impact Assessment
Evaluated how competitor offers, better devices, download speed, and data packages influence customer switching behavior.
Decision Support Dashboard
Designed a clean Excel based dashboard that presents churn insights clearly and supports faster business decision making.
Key Insights
Skills Demonstrated
Microsoft Excel
Created a structured dashboard using Excel based analysis, organized tables, and visual reporting.
Pivot Tables
Summarized large customer datasets to calculate churn rates, customer groups, and reason wise patterns.
Data Visualization
Built charts and visual summaries to make churn patterns easier to understand and compare.
Dashboard Design
Designed a business friendly dashboard layout with KPIs, charts, filters, and clear visual sections.
Business Intelligence
Converted customer data into meaningful insights for customer retention and strategic planning.
Customer Analytics
Analyzed customer behavior, churn reasons, demographic groups, and competitor impact on retention.